

What Is The Harman Curve?
Have you ever wondered what the exact benchmark is for perfect-sounding headphones? If you’re anything like us at Dekoni Audio, you surely have. And if you’re someone who spends countless hours scrolling through audio forums, you may have come across the term Harman Curve. If you have, and this is something you’re unfamiliar with, don’t worry!
In this post, we’re going to dive into some detail about the Harman Curve and how it originated to help give you guys a better understanding of this concept.
If you’d like to watch a video on this topic, you can check out our Dekoni U video where we discuss the Harman Curve and how it originated in detail.

What Is The Harman Curve?
https://jazztimes.com/reviews/products-and-gear/audio-files-the-harman-curve/
Before we get into what the Harman Curve means, it’s important to know where the word “Harman” has been derived from. Harman refers to Harman International, a company that has been known in the audio electronics space since 1953 — back when it was first recognized as Harman Kardon.
Over the span of decades, accompanied by a series of expansions and acquisitions, Harman International became an audio technology powerhouse and leader in psychoacoustic research.
In 2013, following a previous research study regarding the relationship between perception and measurement of headphone sound quality, they published a new research study called “Listener Preference For Different Headphone Target Response Curves.”
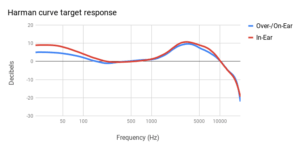
This newfound research regarding the different headphone response curves and listener preferences birthed the widely recognized term, Harman Curve. The Harman Curve is essentially a specific target frequency response that produces the “best possible sound” for headphones.
Frequency response refers to the range of bass, mids, and treble that headphones can reproduce. The ideal frequency range covers the audible sound range of 20 Hz – 20 kHz.
Frequency response also refers to the measure of magnitude or size of the headphone’s output compared to its input as a function of frequency. It essentially shows how accurately the headphones reproduce each frequency of an audio signal in terms of amplitude.
Harman and its researchers wanted to figure out what the best headphone frequency response was because, at the time, there was little-to-no consensus on what the best headphone frequency response was.
What Was The Experiment?
Due to all the uncertainty of what produced the best sound for headphones, Harman decided to experiment and figure out what the most optimal frequency response of headphones was while listening to stereo audio recordings.
In short, Harman conducted blind listening tests on a small group of trained listeners to research common preferences for different headphone frequency response curves. The listeners had varying years of audio experience and complete proficiency in Harman’s “how to listen” software, which trains users how to spot distortions in music.
For the experiment, Harman decided to test with the Sennheiser HD518 and Audeze LCD-2 rev 2 headphones, based on the consistency of seal, low distortion, and extended frequency response.
Both headphones were also circumaural, or around/over the ear, so they always had a consistent coupling to the user’s head. The headphones also had varying price ranges, with the Sennheiser being $125 and the LCD 2 being $995 at the time.
To find the curves they needed for the experiment, Harman’s researchers conducted a no EQ test. EQ means equalization, which is the process of altering the frequency response of an audio system by adjusting the amplitude, or volume, of audio signals.
Once they conducted a no EQ test, he created six different equalizer models, including their loudspeaker frequency response from their Harman reference listening room.
These frequency responses came from previous psychoacoustic research. The curves Harman ended up using were called the RR_G and RR1_G curves. The RR1_G curve was a straight line that sloped downwards as the frequency increased, whereas the RR_G curve corresponds to a straight horizontal line with boosted bass. The RR1_G, when used in loudspeaker listening experiments, was the preferred frequency response.
Once they figured out measurements, Harman researchers took a small group of 10 employees with audio listening experience and had them test each headphone six times for a total of twelve tests. Each subject was to give an 11 point rating system for preference. The subjects were allowed to switch through frequency responses and programs — such as different sounds and music — and give feedback freely. The programs or music they decided to test with were based on them having a wide frequency range and high-quality audio recordings. If you’re wondering which tracks they used, they used:
- Jennifer Warnes – Bird on a Wire (Female Vocals)
- Steely Dan – Cousin Dupree (Male Vocals)
- Dallas Wind Symphony – Tchaikovsky’s Parade of Wooden Soldiers (Classical)
Alright, now that you have a good idea of how the experiments were conducted, you may be wondering what the results ended up being.
What Were The Results?

For the end results, the Harman researchers discovered that the test using Audeze LCD-2 headphones showed that the RR1_G response curve was by far the most preferred, compared to the RR_G response curve. And after equalization, the Sennheiser HD518 scored a higher rating with the RR1_G over the RR_G response curve as well.
The researchers cited that the correlation seems to be that stereo recordings mixed on a stereo monitor system sound the best when your headphones are equalized the same as a stereo loudspeaker system.
When the listeners were asked about their personal opinions, the researchers discovered that “The most preferred headphone target responses were generally described as sounding neutral and well balanced. The less preferred headphone target responses were frequently described as sounding too bright, dull, thin, and colored.”
Conclusion
And there you have it. Hopefully, you were able to get a better understanding of what the Harman Curve is and how they determined the best frequency response curve for headphones.
Because headphone listening experiences and audio in general is subjective, many audiophiles and headphone enthusiasts have debated whether the Harman Curve is a good benchmark for headphone frequency response and still remains up in the air to this day.
If you’re someone looking to further the comfort and sound of your headphones, check us out at Dekoniaudio.com where we have attenuation kits and upgraded ear pads which can allow you to modify the sound of your headphones as you pursue the perfect listening experience.